

Sales By Location
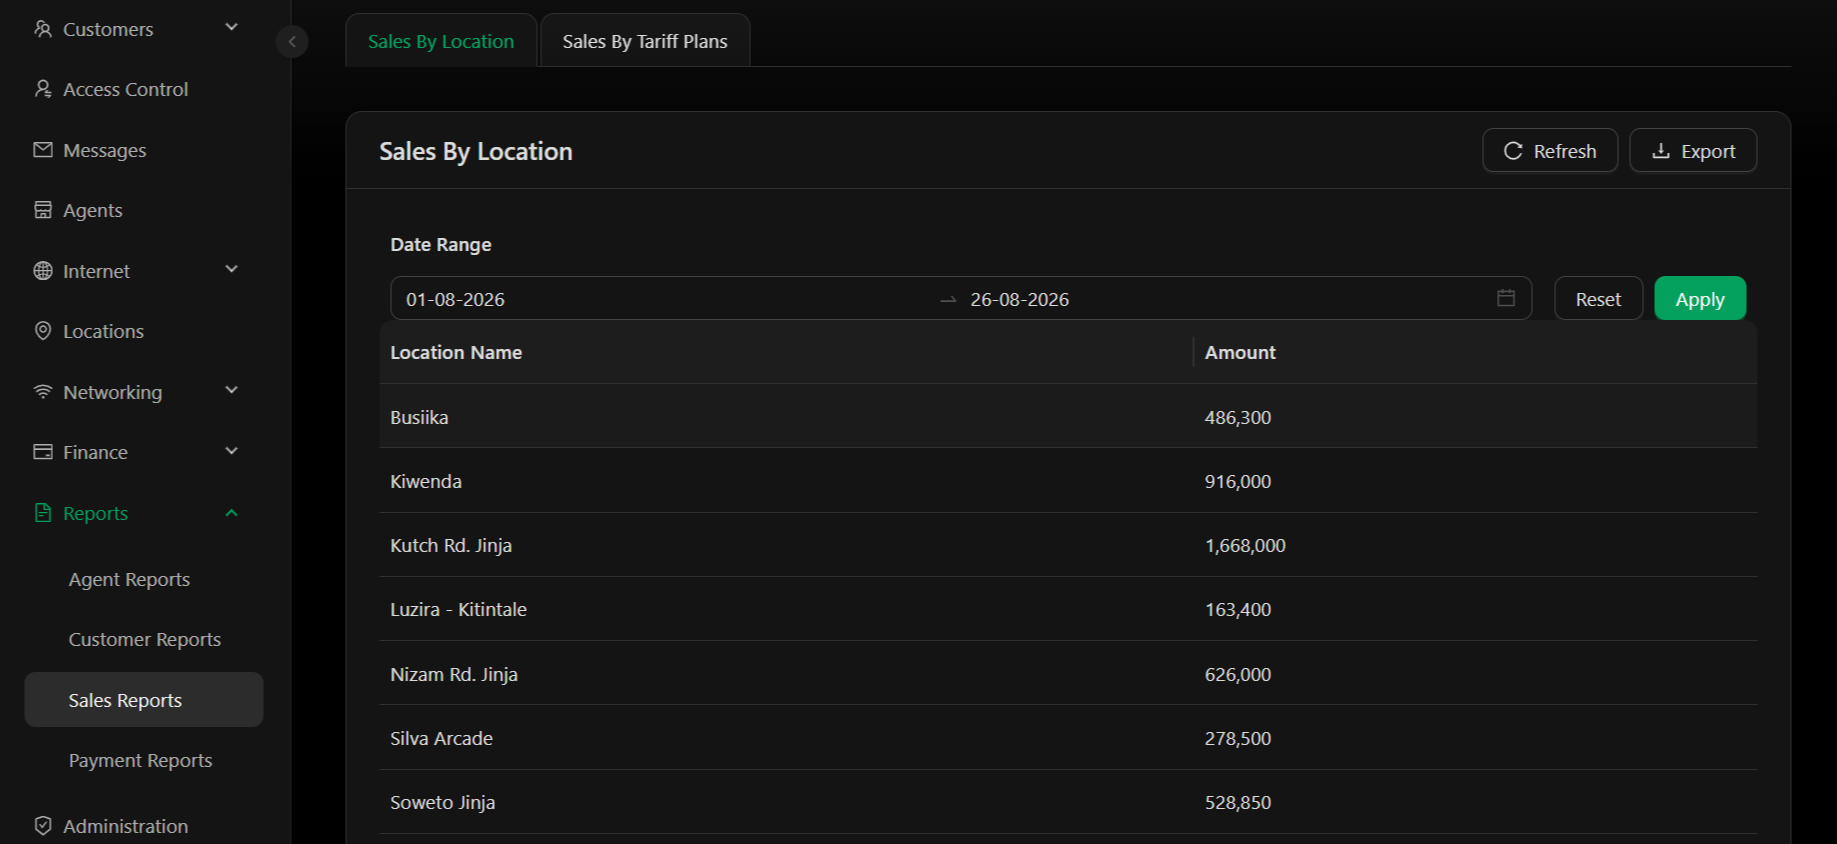
Example Data:
- Kutch Rd. Jinja: 1,668,000 (highest performing)
- Kiwenda: 916,000
- Nizam Rd. Jinja: 626,000
- Soweto Jinja: 528,850
- Busiika: 486,300
- Silva Arcade: 278,500
- Luzira - Kilintale: 163,400 (lowest in this period)
- Date Range – Select start and end dates to view sales for a specific period (e.g., 01-08-2026 to 26-08-2026)
- Identify high-performing locations for expansion or additional resources
- Spot underperforming locations that may need marketing attention
- Compare location performance month-over-month
- Allocate marketing budget based on revenue contribution
Sales By Tariff Plans
View revenue breakdown by internet package/tariff tier. Understand which packages are most popular and generate the most revenue.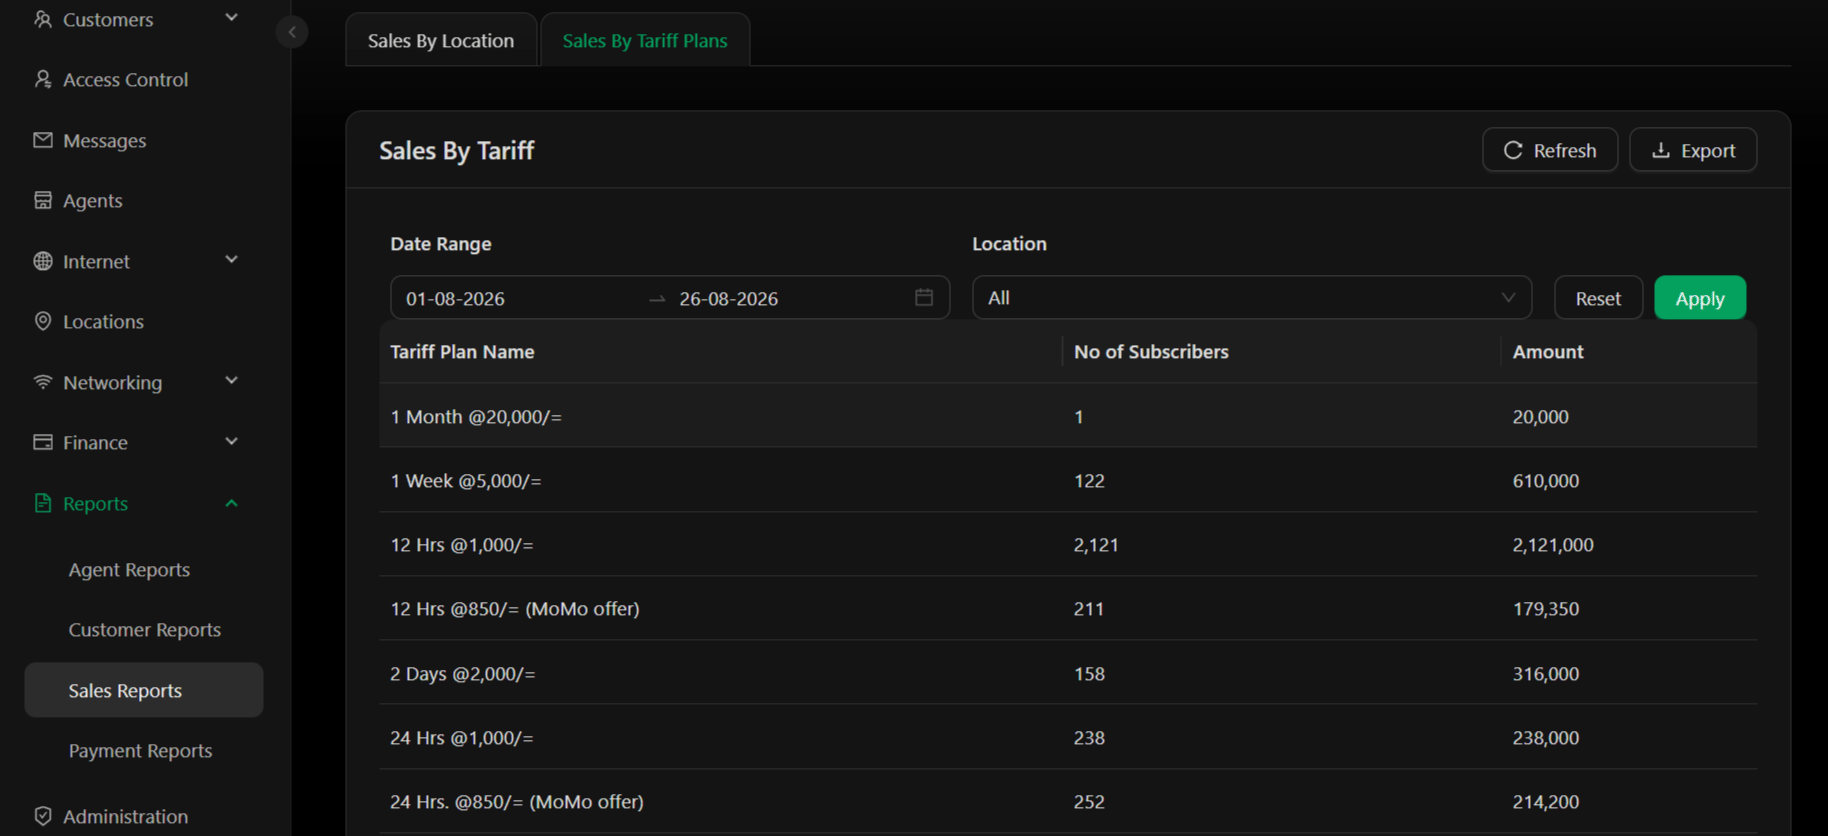
Use Cases:
- Identify which packages drive the most revenue
- Spot pricing optimization opportunities
- Plan product roadmap based on popular packages
- Forecast capacity needs based on plan adoption
Filters
Date Range – Select custom start and end dates to view sales within a specific period Reset – Clear filters and return to default view Apply – Apply selected filters to update the reportActions
- Refresh – Reload report data to see latest sales figures
- Export – Download report as Excel file for further analysis, presentations, or record-keeping
Key Metrics
Total Revenue by Location – Compare location performance to identify geographic growth patterns. Plan-Based Revenue – Understand which packages are most profitable and popular. Period-Over-Period Growth – Use date range filters to compare sales across different months or quarters to identify growth trends.Use Cases
- Location Performance Analysis – Identify top-performing locations and understand what drives their success
- Package Strategy – Determine which tariff plans to promote or retire based on revenue contribution
- Capacity Planning – Use sales data by location to plan network upgrades and infrastructure needs
- Agent/Location Assignment – Allocate agents to high-potential locations based on revenue data
- Pricing Strategy – Analyze which plans are most popular and consider pricing adjustments
- Forecasting – Use historical trends to forecast revenue for upcoming periods
For agent-specific performance metrics, see Agent Reports. For customer-level activity, see Customer Reports. For payment collection status, see Payment Reports.